
- Oil Expeller, Oil Press and Oil Refinery Machine Supplier
- ----------Shandong Leader Machinery Co.,ltd.
Home> Company News> Edible oil Analysis
- AddressNo.15, Lanxiang Road, Tianqiao District, Ji'nan, Shandong, China
- Factory AddressWest Of Jiyang Road,Rencheng Dist., Jinan, Shandong, China
- Worktime9:00-18:00
- Phone(Working Time)86-0531-85064681
- Phone(Nonworking Time)86-0531-85064681
- Fax86-0531-85064682
Edible oil Analysis
2018-08-31 10:19:011 Detection index of edible oil
The initial judgment of the edible oil can be made by looking at the color, smelling, taste, listening to the burning sound, and asking for the sensory inspection. Obviously, sensory testing is subjectively influenced by subjectivity, poor accuracy, and the method of adulterated adulteration is becoming more and more sophisticated. It is difficult to identify its quality. Therefore, physical and chemical testing indicators must be used for testing. The conventional physical and chemical indicators currently studied are mainly water, specific gravity, refractive index, saponification value, acidity, carbonyl value, peroxide value, iodine value, heavy metal, sodium dodecylbenzenesulfonate content, relative unsaturation of fatty acids, fatty acids. Composition, trans fatty acid content, cholesterol, sodium content, chloride ion content, sodium glutamate residue, volatile organic compounds, oxidation products, and the like.
The inferior adulteration of edible oil is a problem that China's food safety needs to solve. On the one hand, inferior adulteration of edible oil or even waste oil, through deep refining, these conventional physical and chemical indicators can reach the level stipulated by the national edible oil hygiene standards; On the other hand, there are many types of inferior adulterated edible oils. The accuracy of the identification of individual indicators for oil identification is poor, and it cannot be qualitatively quantified. Therefore, the detection of the quality of edible oil should be based on a reasonable method, combined with single indicators and multiple indicators.
2 Detection method of edible oil quality
2.1 Conductivity method
Edible oils are electrically conductive, and different types of oils have different electrical conductivity to analyze oil components. On the one hand, inferior adulteration of edible oil contains a small amount of salt and metal ions, which makes it have certain conductivity; on the other hand, extremely inferior oil such as waste oil contains a large amount of water-soluble substances, which will greatly improve its conductivity. Oliveri et al. [1] used platinum microelectrodes to measure the conductivity of different edible oil samples. The results showed that the conductivity of different edible oils was different. Yu et al [2] used the conductivity method to detect the content of free fatty acids in edible oil to judge the quality of oil. Kumar et al. [3] studied the inverse relationship between viscosity and conductivity in edible oils. Wang Feiyan et al [4] tested the water phase conductivity of oil after treatment under certain conditions, the oil of the trench oil was 22.37~44.61μs/cm, and the edible oil was 3.18~9.18μs/cm. Zeng Yifan et al. [5] used a two-channel method to detect the conductivity of a sample solution. The results showed that the conductivity of the sample containing the waste oil was greater than 10 μs/cm. The technical defects of this method are as follows: 1 The content of qualified edible oil must be less than 80% before it can be identified; 2 If the inferior adulterated oil is passed through deep refining, the electrical conductivity can be completely within the conductivity standard of qualified edible oil.
2.2 Spectroscopy
2.2.1 Near-infrared spectroscopy Near-infrared spectroscopy is the use of characteristic absorption of organic compounds in oils in the wavelength range of 78~2 500nm to analyze the components and contents of the tested oils, thereby determining the quality of the oil. It is fast, efficient, does not destroy samples, requires no pre-treatment, and can be tested simultaneously with multiple inspection indicators. Schulz et al [6] studied the essential oils obtained from thyme, oregano oil and citrus by FTIR-ATR and near-infrared spectroscopy, and found that it is not necessary to use any chemometric algorithm to directly use the infrared spectral fingerprint region (900~1 400cm). -1) Qualitative identification. Mailer [7] collected olive oil samples from each of the 165 olive growing regions in Australia as regional representatives. The near-infrared spectroscopy method was used to successfully detect the quality parameters of olive oil in different regions. Alireza et al. [8] analyzed the quality change of heated edible oil by near-infrared spectroscopy, and reflected the acid value, total polar component and oil sample viscosity as the quality grade index in the range of 400~1 750nm. The spectra were analyzed and found to have a predictive power value of more than 0.92. Xie Mengyuan et al [9] caused the waste oil and edible vegetable oil to be absorbed by near-infrared spectroscopy, and the ratio of the spectral intensity of the edible vegetable oil to 885 nm and 897 nm was greater than 1.4, while the waste oil was less than 1.1; at 2 430~2 445 nm and 2 465 The edible oil in the ~2 485 nm band has a distinct peak, while the trench oil has no peak. Liu Yande et al [10] carried out near-infrared spectroscopy analysis of sesame oil mixed with different proportions of soybean oil, corn oil and peanut oil in the range of 4 420~12 000 cm-1, and found that the correlation coefficients of the three plant oil interaction verification models are Near 100%, the root mean square error of internal interaction verification is below 0.3%. Since the near-infrared spectrum is the frequency doubling of the molecular vibrational spectrum and the absorption of the combined spectrum, the sensitivity is low, and the inferior adulteration content detected is generally required to be greater than 1%.
2.2.2 Fluorescence Spectrophotometry Fluorescence spectrophotometry is based on the difference in the fluorescence peaks of the surfactants in the oil at the characteristic fluorescence to determine the quality of the edible oil. Sikorska [11] studied several vegetable oils in the Polish market, including soybean oil, rapeseed oil, corn oil, sunflower oil, linseed oil and olive oil. The two different positions of the oil were detected by fluorescence spectrophotometry to judge the edible oil. category. Poulli et al [12] used fluorescence absorption spectrophotometry to detect olive pomace oil, corn oil, sunflower oil, soybean oil, rapeseed oil and walnut oil doped in light-quality high-quality olive oil, and accurately determined the content of doping. . Chen Weizong et al. [13] discussed the relationship between fluorescence intensity and oil quality by fluorescence detection and analysis of frying oil used in the market. Fang Huimin [14] analyzed the synchronous fluorescence spectra and three-dimensional fluorescence spectrum of rapeseed oil, corn oil, sesame oil, sunflower oil and peanut oil, and found that its spectral characteristics can be used for the identification and quality detection of vegetable oils. Yan Yutong et al [15] analyzed the fluorescence spectra of pure edible oil and arowana cooking oil dissolved in salt, sugar and monosodium glutamate. The results showed that the fluorescence intensity of the two was quite different. Although fluorescence absorption spectrometry has high sensitivity, selectivity, convenience, and the like, the instrument is expensive and extremely sensitive to environmental factors, such as temperature and humidity, which limits the method.
2.2.3 Atomic Absorption Spectroscopy Atomic absorption spectrometry is based on the characteristic absorption of the characteristic line of the element to be tested radiated by the edible oil vapor. The technology has the advantages of high selectivity, high sensitivity, wide analytical range, strong anti-interference ability and high precision. Sun [16] used atomic absorption spectrometry to determine trace amounts of copper and iron in edible salad oil. Berndt et al. [17] used atomic absorption spectroscopy to determine trace elements Al, Cr, Cu, Fe, K, Na, Ni, Pb, Si and V in oil, and finally obtained samples that were diluted by pneumatic atomization in the test. Zakharov et al. [18] used atomic absorption spectrometry to directly determine phosphorus in different types of vegetable oils, with satisfactory accuracy and precision. Deng Hua [19] and Wang Li et al [20] extracted the sodium ions in the oil and used this method to determine the sodium content in the waste oil, and found that there is a significant difference compared with the sodium ions extracted from the qualified edible oil. Tang Yan et al [21] used the HNO3-H2O2 digestion of the frying old oil, and detected the Pb, Zn, Cu and Fe elements by atomic absorption method, and compared with the qualified edible vegetable oil, the four kinds of metals in the fried old oil were found. The ion content is much higher than the qualified edible vegetable oil. Because of the large amount of basic data measured by this method and the narrow linear range of the working curve, it is inconvenient for the actual analysis work, so the detection precision is also low in the low-content inferior adulteration oil.
2.2.4 Raman Spectroscopy Raman spectroscopy belongs to the diffraction spectrum, which reflects the difference in chemical composition and molecular structure of the sample from the molecular vibration level, that is, it has fingerprint property, so that the edible oil can be detected without contact. Farid et al. [22] selected soybean oil, sunflower oil, corn oil, palm oil and coconut oil as the research object, and selected 2 800~3 200 cm-1 regional characteristic bands to quantitatively measure total unsaturated fatty acids and total fatty acids of different oils. , quickly obtain the ratio of unsaturated acid of different oils to estimate the degree of adulteration. Yang et al [23] identified Raman spectroscopy for high-quality olive oil doping, and modeled by partial least squares method, the correlation coefficient was as high as 0.997, and the prediction error was only 1.72%. Feng et al [24] examined the fluorescence spectra and Raman spectra of various oil samples. On the Raman spectrum, the Raman peak of the recovered oil was more and there were fewer peaks than the vegetable oil in the vicinity of the 3 000 cm-1 band. Zhou Xiujun et al [25] used the unsaturation two-point method to extract the Raman spectrum peaks of the 43 types of edible vegetable oil samples, and proved that it is better than the plant oil samples extracted by principal component analysis. This method has the advantages of being fast and simple, without damaging the sample, but accurate process analysis and the accuracy of a large amount of data will have a direct impact on the final analysis results.
2.3 Chromatography
2.3.1 Thin-layer chromatography Thin-layer chromatography is the separation and detection of polar substances in oil. Turina et al. [26] successfully determined trace lead contamination in mineral oil samples by thin layer chromatography and pointed out that the method is equally applicable to other oils and fats. Checheta et al [27] used thin-layer chromatography to detect the content of impurities in oil-based vitamin preparations, and pointed out that this method provides a possibility for their isolation and identification. Li Changmo [28] used thin layer chromatography to determine the content of polar compounds in oils and fats according to the specific shift value of specific indicators in various high temperature oxidized greases. Huang Jun et al [29] used thin-layer chromatography to compare the polar components of swill oil with edible vegetable oil and its refined oil, and found that swill oil has obvious tailing phenomenon on thin-layer chromatography, while edible vegetable oil and refining There is no oil. The method is intuitive and rapid, but has many manual steps, is susceptible to human factors, and is subjective. For low-quality inferior adulteration cooking oil, the sensitivity and accuracy of thin-layer chromatography detection are reduced.
2.3.2 Gas Chromatography Gas chromatography is a column chromatography separation technique using gas as the mobile phase (flow phase). It is the main method for detecting the fatty acid content in oils and fats. It has the advantages of high sensitivity, high efficiency, fast speed and low sample usage. Szarka et al. [30] used gas chromatography to detect the volatile components of the distilled marigold oil gas. Van Rutha et al. [31] used gas chromatography to detect the content and type of triacylglycerols, fatty acids and volatile components in oils and fats, combined with principal component analysis and partial least squares data processing techniques, for animal fats and recycled food. The oil is classified and identified. Shi Zhaohui et al. [32] used gas chromatography to study the different fatty acid peaks produced by different oils. The peak of the waste oil was the strongest. Xu Xiuli et al [33] used gas chromatography internal standard method to determine the content of 37 fatty acids in various vegetable oils, waste oils and animal oils, and analyzed the fatty acid composition and differences, and found that each edible oil has a difference, among which the waste oil The difference from edible oil is obvious and can be used as the basis for discriminating edible oil.
2.3.3 Liquid chromatography When the liquid phase is liquid, it is called liquid chromatography. When separating oil by gas chromatography, high temperature is generally required to vaporize the oil, but liquid chromatography can be used in oil at normal temperature. Free fatty acids are detected and the operation is relatively simple. Moh et al. [34] determined the contaminated edible oil by high performance liquid chromatography with heptane and isopropanol as mobile phases. Rauber et al. [35] used Spherisorb as the CN column, n-hexane and ethanol as mobile phases, and established high performance liquid chromatography to quantitatively determine citral in lemongrass volatile oil from linearity, precision, accuracy and specificity. Excellent performance in the parameters. Qi Zhi et al [36] used ZORBAX 80AExtend-C18 column, dansyl chloride as derivatizer, ammonium acetate and acetonitrile as mobile phase gradient elution, established by high performance liquid chromatography to determine the content of waste oil contained in cooking oil. Contains 5 biogenic amine contents. Liu Qingju et al [37] established a method for cluster analysis of waste oil based on high pressure liquid chromatography. It is assumed that the main components of the target oil sample are divided into triglycerides and other impurities, and the ionization time of flight (MALDI) is solved by matrix-assisted laser. -TOF) Analysis of mass spectral peaks and clustering of high-pressure liquid chromatography peaks to achieve oil product analysis and detection with an accuracy of 92.3.
2.4 Mass Spectrometry
Mass spectrometry is an analytical method that converts a sample into moving, charged ion fragments and separates and records them in a magnetic field at a mass-to-charge ratio (m/z). Mass spectrometry can be used for qualitative analysis, structural analysis and quantitative analysis. It has the advantages of high sensitivity, fast analysis speed and can be used in combination with various chromatograms. Jeung Hong et al. [38] used a mass spectrometry-based electronic nose and gas chromatography on a mixture of palm essential oil and palm stearin. The discriminant function analysis showed a clear separation between pure palm oil and palm stearin. Cihelkova et al. [39] used this method to refine sunflower oil under high temperature conditions and discriminate the degree of sunflower oil refining according to the mass spectrum peak. Wang Le et al [40] used HNO3-H2O2 acid system to digest the oil, and then detected the contents of Fe, Cr, Zn and Mn in the trench oil by inductively coupled plasma mass spectrometry. Fang Xiaowei et al. [41] analyzed the different quality and types of edible oil by mass spectrometry and principal component analysis without the need of sample pretreatment, and screened different quality edible oils from the obtained fingerprints. This mass spectrometry method has the disadvantages of cumbersome pretreatment, time consuming analysis and the like. Liquid chromatography-mass spectrometry (LC-MS) combined with [42,43], gas chromatography-mass spectrometry (GC-MS) [44,45], headspace-temperament (HS-GC-MS) [46,47] and supercritical fluid chromatography-mass spectrometry [48] technology and other mass spectrometry techniques should be widely used in the quality testing of edible oils, reflecting the flexibility and practicability of mass spectrometry.
3 Conclusions and prospects
In the quality testing technology of edible oil, it is mainly to use a reasonable method to detect specific components in edible oil. With the advancement of science and technology and the continuous establishment of new analytical methods, the quality testing techniques of edible oils tend to be diversified. However, the current unqualified edible oils, especially the waste oils, have difficulties in sampling, variable composition, temperature disturbance and other factors. The development of detection technology. Non-destructive testing technology for fast, accurate, low-cost, portable, high-precision, low-carbon environmental protection of edible oil quality is the key to promoting the quality and safety of edible oil. At the same time, we should also increase scientific research, change our mindset, and use inedible oil as a fuel for power generation and other recycling, contributing to the development of the national economy.
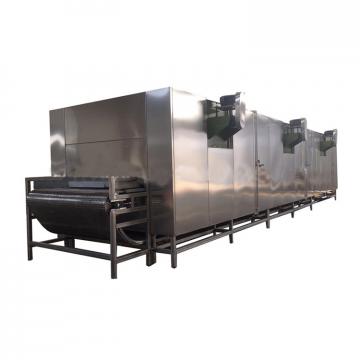 Fruit Processing Line Apple Pear Fruit Juice Sugar Processing Production Line
 Apple Washing Line Air Bubble Fruit Vegetable Washer Vegetable cleaning machine potato bubble cleaning
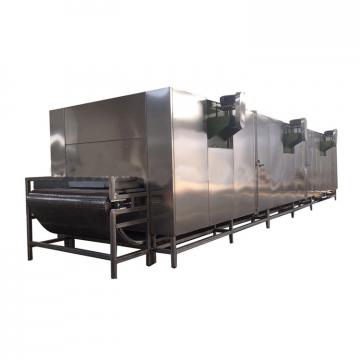 Root Vegetable Peeling Cutting Fruit Cleaning Equipment Conveyor Belt Vegetable Processing Machinery Production Line
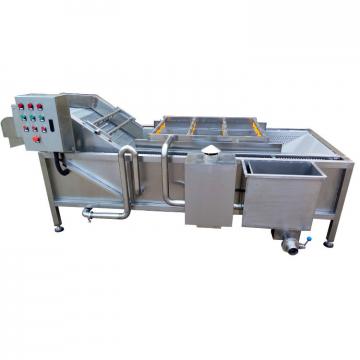 fruit juice juicer production line processing machine
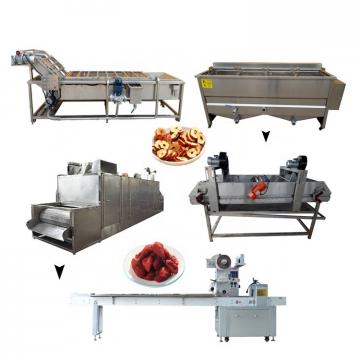 Factory Hot Sale Juice Hand Machine 100% Fresh Fruit Juice Production Line Machine